


Analytics is one of the most important features of any eCommerce website. It not only helps you see how your customers are interacting with your store and what they're doing, but it can also help you improve your store or find new ways to generate revenue.
But with all of the complications, it can be an overwhelming task to understand Shopify Analytics and all its intricacies. But don't worry! We're here to clear the air and a little more, so you are utterly comfortable with Shopify Analytics - from start to finish.
First, let's understand what exactly Shopify Analytics is, and why it's helpful for business analytics.
What is Shopify Analytics?

Shopify Analytics is a tool that helps you measure and understand your store’s performance. You can use Shopify Analytics to track the growth of your business, see what products sell best, find out how many customers visit your website, and much more.
Before moving forward, it's important to note that Shopify data and Google Analytics data are two different things, and yes, they can be connected to be used together (which we will look into in later sections of this guide).
It's important to note that Shopify stores contain different types of data, compared to other eCommerce platforms, like Magento or WooCommerce — this makes it so they can’t be compared directly with Google Analytics.
However, by connecting your Shopify store to Google Analytics, you can still get valuable insights into how people interact with your website (and thus, what they need). This can go a long way in improving your Shopify conversion rate.
The two data sets work together to give you a complete picture of your business. Here’s how:
- Shopify data gives you a snapshot of what’s happening on your website. This includes things like the number of visits, sales, traffic sources, and more.
- Connecting this data to Google Analytics allows you to see how people are interacting with your store (what pages they visit, where they come from).
Great! Now that you know what Shopify Analytics is, let's jump into why you need it!
Why Do You Need Shopify Analytics?

Shopify Analytics is the best way to know what's happening with your store. It's the only place where you can see your sales, traffic, and other key Shopify metrics together in one place.
Why do you need it? Because it gives you valuable insights into -
- Your store's performance—how much revenue are you making? How many customers are visiting? Are they coming from social media or search engines? Where do they live?
- Where are you spending money— This can tell you where your spend has been allocated. It can help you plan and budget for your store by giving you information on multiple factors, such as what marketing channels are working well for you and which ones aren't getting results. It can also tell you what products should be promoted more heavily on social media platforms like Facebook or Instagram (if applicable).
- What's working and what isn't— It can give you valuable insights into which products have higher conversion rates, which categories receive more traffic, how often people come back after making a purchase, how long it takes them to complete their purchases when they spend money with their credit cards instead of PayPal accounts, and more.
- It also provides key information about the demographics of your visitors- This could include information like where your visitors are from, which website they were redirected from, how old they are, which gender they belong to, and much, much more.
- Shopify Data Analytics can give you a view of your store's performance - It can even provide you with information about your product performance. This can allow you to make informed decisions about individual products in your store and understand their current performance and how it can be improved.
- Analytics for Shopify gives you a great amount of power in terms of inventory management - You can identify areas or groups of your inventory that need attention, know your stockpiles, get rid of unsold inventory, understand waste, and more.
How to Use Shopify Analytics
As we've just seen, Shopify's analytics and reporting tools allow you to evaluate current activity in your store, have a better knowledge of who is visiting your online store, analyze performance indicators, etc.
Not only this, but Shopify Analytics also provides you with reports that you can use to analyze various aspects of your store, including sales, marketing, visitor stats, and more. Besides this, Shopify also provides you with a comprehensive Dashboard to view details about your store at a glance.
Accessing your Dashboard and Shopify reports is simple.
- First, log-in to your Shopify store and look in the left-hand menu for them.
- You may receive different reports depending on your Shopify membership.
- Everyone has access to the Overview dashboard, finance reports, and product analytics. Other reports are available with different paid plans for Shopify, like Shopify Plus.
While reports can be great for exporting large amounts of data from your store, they aren't of much help unless you can have them thoroughly analyzed. Analyzing your data can be the difference between having a lot of data available and getting the answers you need to help grow your store.
With proper analysis of your store data, you should be able to -
- Grow your business in areas that are lacking.
- Understand pain points within your store and plan to overcome them.
- Plan for the future and expand your business successfully.
When you have access to the information that can help you get more insight into your store's data, asking the right questions can help you analyze your stats much better.
When you review your data, ask yourself questions like, "Is there a more efficient way to do this?", "How can I simplify this process?", "Is this product ready to scale?". In this way, analyzing your data can help you get ahead by giving you a top-down run down of your store's performance.
But to obtain this visual, you'll have to understand the different types of Shopify reports that you can create and export.
Shopify Analytics Reports Types
Shopify's analytics and statistics enable you to review your store's current activity, acquire insight into your visitors, analyze your online store speed, and analyze your business's transactions. As previously mentioned, every store owner has access to the Analytics page and essential financial information.
Some types of Shopify Reports are only available on certain versions of Shopify. For example, to access Shopify Sales Reports, you will need Shopify Plus. However, all versions of Shopify - from Lite to Plus - have the basic Products Report.
Here's a table for more clarity:
Overview Reports
The dashboard displays the essential indications that give insight into the operation of your shop and consumer behavior.
When it is applicable, the metrics are displayed quantitatively as well as visually. For all indicators, the percentage change from the previous date range can be specified.
Product Reports
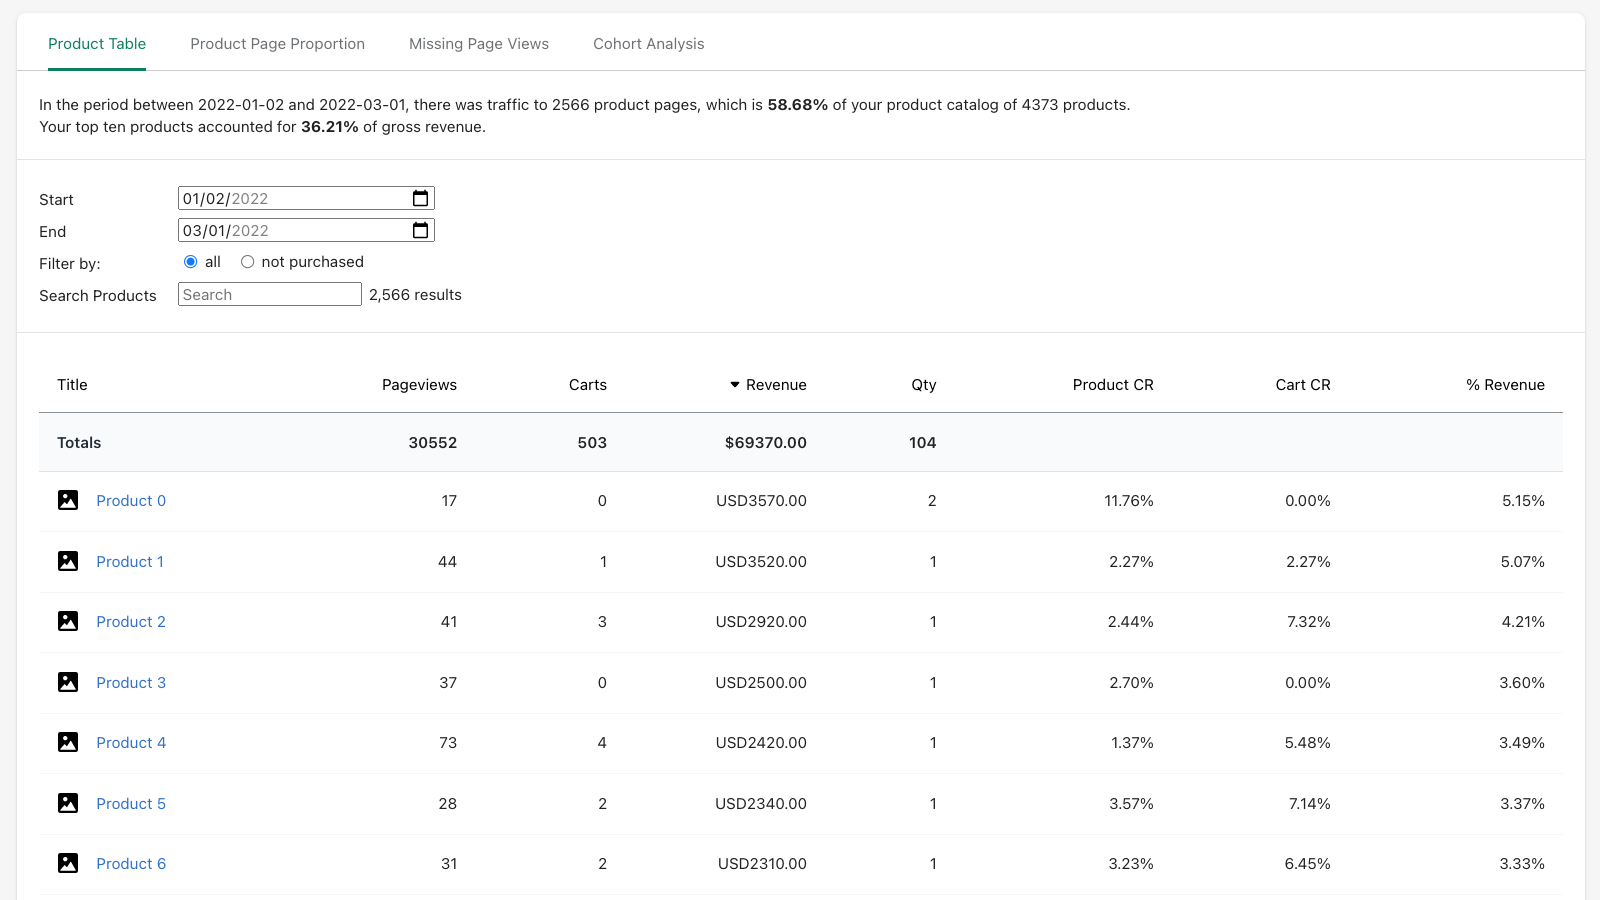
Product reports provide insight into individual products in your store and how they have been performing. While Shopify does not offer a separate product report, you may get information about certain items straight from the dashboard.
- Go to "Product" then click on "All Products" and then choose the product you want to focus on first.
- On the right, find "Insights" and click "View Details".
There's plenty of information that can be gathered from these professional product reports. They can provide you with insight into how your products are performing, the volume of sales for specific products, and much more.
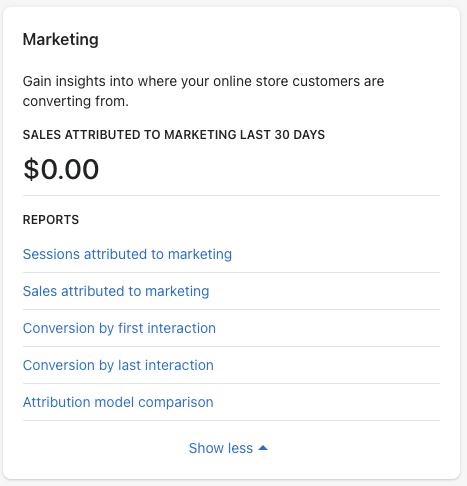
Marketing Reports

Marketing reports enable you to monitor the performance of your marketing efforts.
You may use them to determine how much of your sales are generated by specific channels. Alternatively, you can even procure information on the sales from your targeted campaigns.
You may also compare traffic from social media, search engines, direct links, and any other source that leads to your website.
They can give you insight into -
- "Sessions attributed to marketing" and "Sales attributed to marketing"
- "Conversion by first interaction" and "conversion by last interaction"
- Attribution model comparison
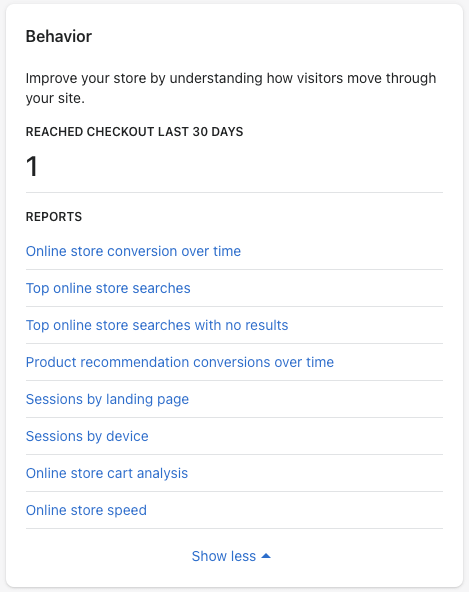
Behavior Reports

Behavior reports are extremely useful for understanding visitor behavior once they have reached your store.
It can give you an idea of the behavior of the users in your store. These reports are there to help you improve conversions and give customers a smooth checkout experience. They can even help you find a conversion-friendly Shopify theme that your visitors are more likely to purchase on by analyzing their behavioral data.
The following reports are available:
- Online store conversion over time
- Online store speed
- Product recommendation conversions over time
- Top online store searches
- Sessions by landing page and by device
- Online store cart analysis
Sales Reports

Sales reports are especially important, not only to give you an idea of your sales numbers, but they can also provide you with key taxation information.
Only the Shopify, Advanced Shopify, and Shopify Plus subscriptions have access to sales information.
There are 11 different sales report types, including sales over time and sales by billing location, sales by channel, and more.
This means that you can narrow down your analysis to get exactly the kind of data you're looking for - without needing to put in a whole lot of extra work to get the information extracted.
Custom Reports
If your store is on the Advanced Shopify or Shopify Plus plan, you may alter default reports and create custom reports using Shopify's filtering and editing features.
- To customize a default report, add filters and update the columns, then save and name it.
- To modify a custom report, edit it and then save it. You may also save the custom report with a different name by choosing Save as.
Custom reports seem similar to conventional Shopify reports, but they use filters to offer exactly the information you need.
How to Analyze Shopify Reports

Shopify reports contain information about your store's sales, orders, and traffic. They're useful for tracking how well your business is doing, as well as identifying areas where you may want to improve.
For example, if you notice that most of your customers come from a specific geographic area (e.g., California) but aren't converting into buyers of their own accord (which is something that can happen if they don't have a credit card or don't want to pay with PayPal), you could try optimizing for mobile devices in those areas first.
If this increases conversions among those groups of people who tend not to purchase online due to security concerns or lack of payment options like PayPal, this will be considered an improvement worth making!
Next, let us look at optimizing your business with Shopify Reports!
How to Optimize Your Business with Shopify Reports
Now that you know how to use Shopify Analytics, it's time to put those insights into action.
The most important thing is to start analyzing your store data as soon as possible. That way, you can start improving your business before anything goes wrong.
There are a few ways you can use Shopify reports for marketing purposes. If a customer buys something from your store and then returns it later on (which happens often), there might be something wrong with their experience or with what they bought from you in the first place.
So by looking at these types of reports, you'll know exactly where customers struggle and what products aren't selling well enough, so they can not only buy again but tell others about them too!
How to Connect Your Shopify Data With Google Analytics?

If you have a Shopify store and want to use Google Analytics to track your store’s traffic, orders, or sales data, then this section is for you. We will teach you how to connect your Shopify data with Google Analytics.
To link Shopify and Google Analytics, you need an account in both services:
- A free or paid plan with Google Analytics
- A Shopify account
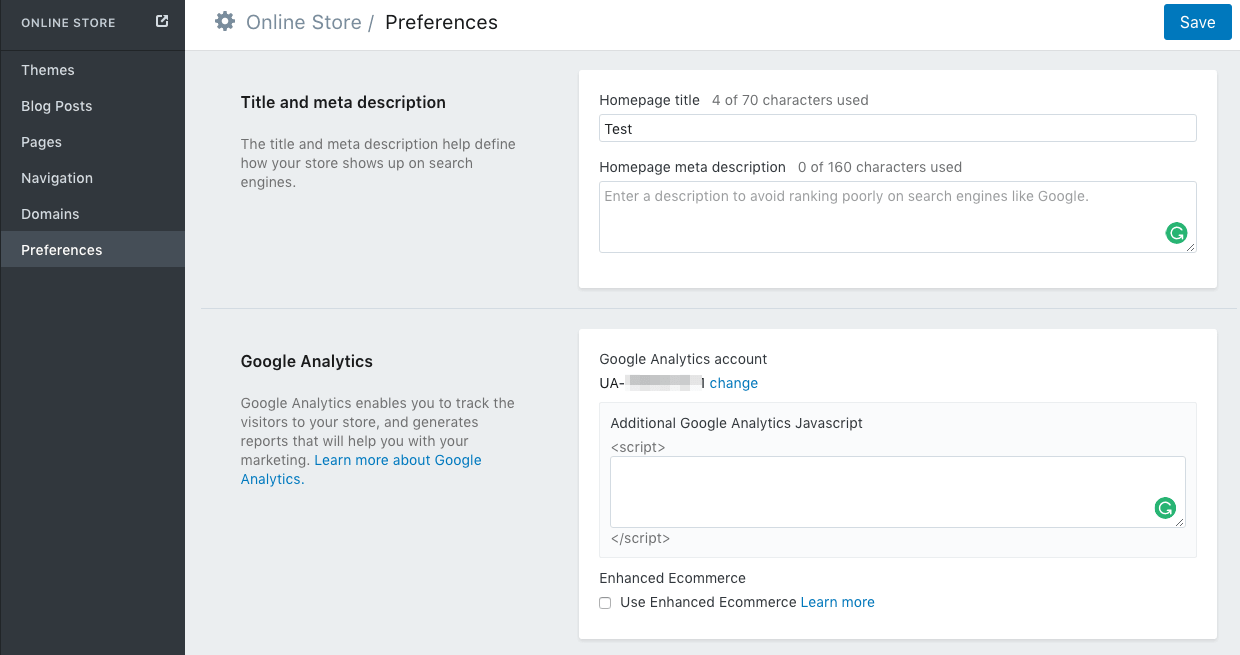
First, you need to set up Google Analytics on your store. It's easy—all you need to do is install the Google Analytics tracking code on your website. (You can find this code in your store admin, under Settings > General > Tracking Code)
Google Analytics Makes Analysis Easier
Google Analytics overview report shows you a summary of your store's performance and the performance of individual products. It can also analyze your visitor behavior. It can then tell you how visitors interact with your site.
You can even know which visitor reports contain information about your store's traffic and conversion rates. They help understand what drives customers to visit your site, how often they do so (i.e., how many visits are made per day), and how long they stay there before leaving again.
For example, if you notice that most of your visitors come from a specific geographic area but don't convert into buyers of their own accord—something that can happen if they don't have a credit card —you could try optimizing for mobile devices in those areas first.
It does quite a lot to make your analysis easier. For instance, it tracks your visitors and where they come from, what they do while there, and which pages they visit. If you have a lot of traffic coming into your website, it's important to know where it all comes from.
All of this key information can be greatly helpful in increasing your conversions. If you want more people to visit your site, using these reports will help you understand which types of ads are working best for you.

We're doing great so far! Now, we dive deep into the top 5 Shopify analytics apps for your business in 2022.
Top 5 Shopify Analytics Apps in 2022
Shopify is the most popular eCommerce platform on the market, and it's easy to see why. It's easy to use, comes with a lot of great features, and allows you to create a professional online store in no time at all.
However, despite its popularity, there are still plenty of Shopify users out there that don't take advantage of all its features.
This is especially true when it comes to analytics. A lot of merchants just aren't sure what kind of information should be tracked or how they can use it effectively in their business operations - so today, we're going to look at some Shopify analytics apps that will help you get the most out of your data!
1. Conversific Store Analytics

Conversific Store Analytics is a Shopify app that allows you to analyze your Shopify store data. This app allows you to track your Shopify store data and see how it changes over time. It also allows you to track the performance of your products and campaigns.
It can track multiple data points, including -
- The average number of orders per customer
- Average order value (AOV) by product category or SKU
- The average revenue per customer
- Revenue by traffic source
2. Hitsteps Analytics

Hitsteps is a full-featured Shopify analytics app that helps you understand your customers, products, and sales. Hitsteps provides comprehensive reports on your store’s performance, including customer acquisition, traffic sources, and engagement.
You can set up custom metrics to track the performance of different parts of your business:
- Revenue by product category or SKU
- Average order value (AOV) by product category or SKU
- Revenue per user (RPU) by product category
- SKU Customer acquisition costs (CAC) by traffic source
This app is a great way for you to track the performance of your Shopify store, as well as your products and campaigns. It’s very easy to use, and it will allow you to see how various aspects of your store affect each other.
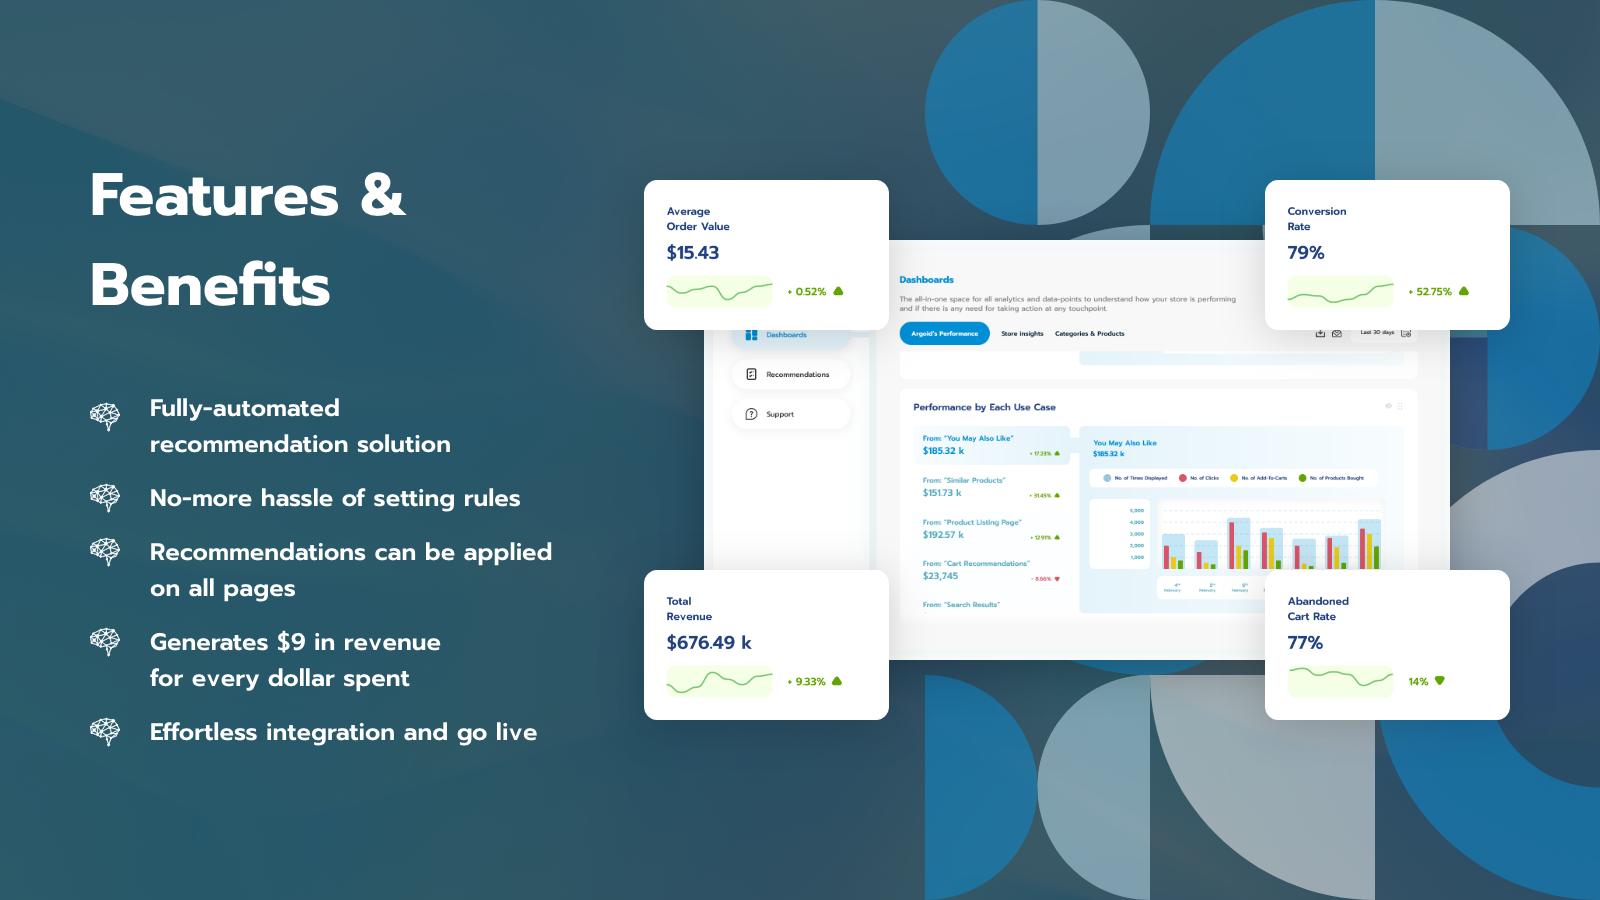
3. Argoid Analytics

Argoid Analytics is a free Shopify analytics app that gives powerful insights into your store's performance.
With Argoid, you can track your store's performance in real-time and make data-driven decisions as they come up. With its deep product intelligence, Argoid helps you understand how products are performing and why customers are buying them.
This way, you'll be able to improve conversion rates and create better marketing campaigns based on the data collected by this tool. It also integrates with Google Analytics so that all of the information from both platforms can be used together for maximum insight.
Argoid helps you track valuable metrics, like -
- Average order value (AOV) by SKU
- The average order value for a product category
- Sales by marketing channel
- Average Conversion rate per page
Retailers can use Argoid to track their store's performance in real-time and make data-driven decisions as they come up. With its deep product intelligence, Argoid helps you understand how products are performing and why customers are buying them.
This way, you'll be able to improve conversion rates and create better marketing campaigns based on the data collected by this tool. It also integrates with Google Analytics so that all of the information from both platforms can be used together for maximum insight.
4. Vantage Analytics
Vantage Analytics is a Shopify analytics app that provides you with the ability to track your store's data, including sales, traffic, and customer behavior.
It can help you make better decisions about your store's performance and growth.
With the ability to track over 120 different metrics, you have a lot of data at your fingertips. And with the built-in reporting tools, you can easily see how your store performs and identify areas for improvement.
The best thing about Shopify Analytics is that it’s completely free to use. It’s also easy to set up and start tracking your store’s data.
5. Analytics Buddy

Analytics Buddy is a Shopify app that lets you monitor your store's performance. The app provides insights into sales, traffic, and social media metrics.
It’s easy to set up and use the Analytics Buddy app. It also has a good customer service team who are ready to help you if you have any issues or questions while using the app. The free version allows you to track your store data and see how it changes over time. It also allows you to track the performance of your products and campaigns.
It's a great tool for maximizing sales and ROI, as well as improving customer experience by making sure that products are accurately categorized based on what people are buying them for. What's more is that the app is easy to install and navigate.
Besides, it has a user-friendly interface and is mobile responsive, so you can access your data from any device. With Analytics Buddy, you can track all the important metrics for your store, including sales, traffic sources, customer behavior, and more.
There are three different plans available to suit your budget and requirement. The Basic plan costs $19 per month and includes data from your sales, traffic, and social media performance. The Standard plan costs $129 per month and consists of all of the features in the basic plan, plus more advanced analytics.
FAQ
1. What is Shopify Analytics?
Shopify Analytics is a tool that allows you to track and analyze the performance of your store. You can use Shopify Analytics to track your company's growth, see which products sell the best, learn how many customers visit your website, and much more.
2. Why do I need Shopify Analytics?
Shopify Analytics is the best way to understand what's going on with your store. It's the only place where you can see your sales, traffic, and other important metrics all in one place.
3. Do I need Shopify Plus to access all report types?
While the basic Shopify plans do come with plenty of report types such as overview reports and product reports, some report types are only available with Shopify Advanced and Shopify Plus, such as sales reports and the ability to create custom reports.
4. Is Shopify analytics better than Google Analytics?
While they both have their pros and cons, both Shopify Analytics and Google Analytics bring a lot to the table for you to analyze your store effectively.
With that said, Shopify analytics lacks some essential features. As a result, the customer journey may be twisted and incomplete. For example, Shopify analytics will not offer you crucial indicators such as client lifetime value (LTV).
5. Is Shopify Analytics a live connector or a storage connector?
Shopify Analytics is a storage connector. The data is updated from your store once an hour.
6. How can I export Shopify Analytics data?
One of the best features of Shopify Analytics is how easily you can export your data.
You can export any report from Shopify Analytics in a few simple steps.
- Launch the report you wish to export.
- Select Export.
- Click Export in the Export Your Report dialogue. You may also choose the kind of report to export for several Finance reports (Sales, Taxes, and Payments).
- The data for the columns that are now shown is exported from the current page.
7. What are Shopify reports, exactly?
Shopify's analytics and statistics enable you to review your store's current activity, acquire insight into your visitors, analyze your online store speed, and analyze your business's transactions. If you own an online store, you can use Live View.
Everyone has access to the Analytics page and important financial information; however, not all types of reports are available with the base Shopify plans.
Conclusion
Shopify analytics is a must-use tool for any business owner. It gives you the ability to track your sales and drive traffic to your Shopify store.
Not only does it provide you with a platform to analyze your sales, but it also allows you to generate in-depth reports that can be exported as .xls/.csv files. You can then take this exported data further into custom analytics data to study further.
You can also use this data to find out what works best for your marketing efforts and optimize your website's conversion rate.
This means that even if you don't have any experience with analytics software, Shopify makes it easy enough for anyone to understand these reports and take actionable steps toward improving their business's performance.


.png)


